�M���������i�����i���U�ذ��D
====�W�j�Τj�ǹA�dz� ���� �¥��դh ====
�@
�����t�J�ս�}�ƹ}�i�����K�[�U���i��Ī��ܡA���J��Ħ��`��������@�ΡA�p�G�A�K�[���ġA�h����ܥX��n���ĪG�A�b���⥦�٧@�J��ġA���Ī�����`���@�ΡC
�J��ġB���Ī�����`���@��
���������J��ĩM���Ī�����`���@�ΡA�i�H�N������P�����B���M���������t�J�ս誺�}�ƮɡA�J��ĥ[�m�B�i�Ī�����`���@�άO�ۦ����C�̤��P�ʪ��i�������P�����ĩM�m�B�i�Ī��զX�C
�o�ةM���������J��ĩM���i�Ī�����`���@�ΡA����T�K��������ƪn�S���v�T(�P���Ʋv�L��)�C���ѩ�����ƪn��֡A������i�X�N�o�H�ﵽ�C(���@)���ܧ�����ƪn����֡A�i�H�Χ��ĺA�������֨ӻ����C(���G)���ܥH���[�J�ս�}�����i�����A�����J��ĩM���ġA�h���ħΦ��Q����C���ıƪn�N��֡A������i�X�N�i�H�Q�ﵽ�C
���@ Nitrogen balance of colostomized cocks fed a protein-free diet with
or without methionine plus arginine or glutamic acid
Amino acid supplement |
N intake |
N excreted |
N balance |
||||
Fecal N |
Urinary N |
||||||
Mg N��bird��3 days |
|||||||
None (PF) 1.48�H Glu (G) 0.3�HMet��0.424�HArg (MA) Pooled SE |
89.6 243.2 234.4 �w |
126.4 146.6 140.8 8.0 |
a a a |
729.8 891.7 548.3 71.2 |
a , b a b |
- 766.5 - 795.1 - 454.0 69.5 |
a a b |
�@
���G Effect of methionine plus arginine supplementation on excretion of nitrogenouscompounds in urine of colostomized cocks fed a protein-free diet
Amino acid supplement |
Total N |
Uric acid N |
Ammonia N |
Urea N |
Total Cre-atinine N |
Undeterm-ined N |
||||||
| �@ | Mg N �� bird �� 5 days |
|||||||||||
None (PF) 1.48�H Glu (G) 0.3�HMet��0.424�HArg (MA) Pooled SE |
729.8 891.7 548.3 71.2 |
a , b a b |
507.8 674.8 356.5 62.4 |
a , b a b |
121.0 132.2 106.0 12.4 |
a a a |
29.4 25.5 50.4 7.4 |
a a a |
46.1 42.9 32.8 4.1 |
a a a |
25.5 16.4 2.7 19.9 |
a a a |
excretion in chicks fed a protein-free diel with or without methi-onine and arginine (experiment 3)
Amino acid supplement |
Energy intake 3 |
Body weight change 2 |
excretion N |
balance N |
Uric acid Ncxcrction |
||||
g��100g BW��10 days |
Mg��100g BW��day |
||||||||
None (PF) �@ Met��Arg (MA) �@ Pooled SE (Energy)2 (AAs)4 |
100�H 75�H 50�H 100�H 75�H 50�H |
- 28.4 - 31.6 - 34.2 - 22.1 - 25.8 - 31.9 0.6 0.8 |
A B B A B C |
62.1 57.0 67.0 37.7 40.5 84.1 2.2 2.8 |
�@ �@ A A B |
- 59.0 - 54.0 - 64.6 - 29.5 - 32.2 - 75.9 2.3 2.8 |
�@ �@ A A B |
23.8 18.7 29.6 7.3 8.8 31.6 1.5 1.9 |
a a b A A B |
�@
���| Changes of tissue nitrogen content in chicks fed equal amounts of a protein-freediet with or without methionine plus arginine (Experiment 2)
Tissue |
Changes in N content |
�H Change | ||
PF |
Met��Arg |
PF |
Met��Arg |
|
mg N��bird��10 days |
�H |
|||
Feathers Liver Spleen GP 2 Heart Pancreas Intestine Kidney Muscle PFC 3 |
161.8± 5.1 1 - 37.3± 3.1 - 1.6± 0.1 - 38.3± 6.7 - 4.0± 1.0 - 14.6± 0.4 - 31.4± 1.5 - 10.4± 0.9 - 291.4±18.1 - 24.0±32.9 |
174.4±10.0 - 44.6± 2.1 * - 1.3± 0.1 * - 25.4± 4.8 - 0.8± 2.2 - 14.5± 0.6 - 17.6± 2.4** - 11.1± 0.8 - 175.6±25.2** - 31.8±21.7 |
68.9±2.0 - 29.1±2.4 - 56.5±4.1 - 23.7±4.1 - 17.9±4.4 - 59.6±1.5 - 35.2±1.9 - 28.4±2.3 - 29.8±2.0 - 2.8±4.0 |
74.3±4.4 - 34.8±1.6 * - 43.4±3.4 * - 15.6±2.9 - 4.2±9.3 - 59.7±2.7 - 19.5±2.6** - 30.5±2.2 - 17.9±2.5** - 3.9±2.7 |
1�FMean±SE of 8 birds. 2�FGlzzard��Proventriculus. 3�FRemainder feather-free carcass. *,**�FSignificantly different from the PF group at P��0.05(*) and P��0.01(**), respectively.
�@
���� Effect of supplementation with methionine alone or in combination with arginine (MA) onfractional turnover rates of protein in the whole-body of chicks fed on a protein-free (PF) diet
(Mean values for five birds except for the PF group being four)
Diet |
Fractional rate |
|||||
Synthesis(�H��d) |
Growth(�H��d) |
Degradation(�H��d) |
||||
Protein-free PF��methionine PF��MA SEM (11 dl) |
11.0 13.5 13.6 0.6 |
b c c |
-2.2 -1.4 -1.1 0.1 |
b c c |
13.2 14.8 14.6 0.7 |
a a a |
�H�e�ʪ��i��ĭn�D�q�O�ѥͲ��q(�Ҧp�魫�W�[�q�B���Z�B���ŵ�)����ǦӨD�o�C���]���n�����P�[�I���ݪk�A�Ҧp���ޡB�m�B�i�ġB���i�Ī��n�D�q�A�Y�H�K�̤�������ǡA�����i���X�O�H���魫�W�[�q����Ǫ��ɭ��٭n���A������]�O�q���i�ijJ��İ_�A�@�몺�i��Ĥ]���P�˱��ΡC�o�˪����i�A�]�}�l���o���A���ޫ��ˡA�����O�H�Ͳ�����ǡC�H�K�̵������d����Ǫ��i��ĭn�D�q���A�˰Q�]�O�C�N�o�Ӱ��D�X�j�_�ӡA���Ҫ��ìV�{�סB�M��{�שM�i��ĭn�D�q�����s�����]�N�|�ܦ����᪺���D�Ia.b.c. Means within the same column not sharing a common superscript letter were significantly difierent
b.c. P��0.01.
�i��Ī���i�S����
Mitchell and Block (1946)�C�Ĥ@�����i��ĩM���Z�J�ս�̧t�������i��Ī���M�ͪ������ܤj�������A�]���o���Fchemical score�������C�o�ӷQ�k�O�q�M�w�F�ʪ����i��ĻݨD�q�}�l�A�Ĥ@�����i��ĩM���i��ĻݨD�q������@chemical score����¦�A�@���i��ĸɥR����z�C�@��ӻ��A�z�שM��ڤW���ƭȱ`�O�@�P���C���O�p�G�ԲӦa�z���A���γo�Ӳz���٬O���ܦh�{�H�L�k�����C
���ԭz���J��ĩM���Ī�����`���@�Τ]�L�k�γo�Ӳz�רӻ����C�٦��̷ӳo�Ӳz�סA���ר��@���i��ħ@�Ĥ@�����i��ij����P�˵{�ת����ʪ��ܡA�ͪ������ӬO�ۦP���A���O�]�����ɬO�p�����ƨҤ����i�C
�խ���͵��H���ۧ@�̡A���@�i��ħ˦��зǹ}�ƪ�60�H�ɡA�������W��������ܥX�������������i�C�ѯʥF�i��Ī������i��ܨ�������t���A�Y�H�n�D�q��50�H�A�Ϩ�ʥF��@�i��Įɪ����G�N�ܦ������C���ˡA�٬O�̯ʥF�i��Ī������A��������Ҥ��P�C���o�˨��i��Ī������B���ʡB�L�Ѫ��v�T���۲��A�٧@���i�����i�S�������C�b���C�i�`�N��c�y�Φ��ܬۦ��A�����ʮɤ��v�T�{�פ��P���������i��ġC
�����������ʵ{�שҼv�T�����i�ġA�����{�ת����i�Ĥ��ʼv�T�j���������i�ġC�o�dz�@�i��ĥ��̤���25�H�ɩM����75�H�ɪ��լd�N�p�P���K�A����25�H��(b��a)�i��Ķ����Ӧ���t���A����75�H�ɡA(c��a)�N�i�H�M���a�ݥX�i��Ķ����t���ܤj�C�]�N�O���A�i��Ī���i�S���ʤ��ʵ{�פp���ɭԬO�����㪺�A�����ʵ{���ܤj���ܡA�i��Ī���i�S���ʴN�|�ܱo����C
���� Weight gain, feed consumption and feed efficiency of chicks
fed diets equally deficient in a single amino acid (assay2)1
Amino acid held at 60�H of RS |
Gain |
Feed consumption |
Gain��Feed |
All �l 60�HRS Methionine��cystine Leucine Lysine Arginine Histidine Threonine Valine Isoleucine Tryptophan Phenylalanine��tyrosine None �l RS |
g��chick��day 8.60±0.562 9.89±0.46 9.72±0.67 9.54±0.51 9.27±0.19 8.24±0.41 7.89±0.44 7.41±0.28 6.12±0.55 5.94±0.16 5.73±0.44 13.16±0.23 |
g��chick 112.2 104.1 94.1 102.2 104.9 91.6 96.6 88.9 81.6 77.5 74.7 112.8 |
0.46 0.57 0.62 0.56 0.53 0.54 0.49 0.50 0.45 0.46 0.46 0.70 |
1. Two replicates of 10 male chicks��treatment. 2. Mean±SE of mean.
�@
���C Performance of chieks fed on diets deficient in single essential amino acids,and metabolisable energy values of the diets (values are means of five birds for period 8 to 18 d old)
Deficient amino acid |
Weight gain (g) |
Food consumption (g) |
Weight gain |
ME (MJ��kg) |
Food eaten |
||||
None Lys Leu Phe��Tyr Met��Cys Trp His Val Arg Thr Ile Pooled SE |
55.8 50.6 45.0 40.4 32.4* 31.2* 27.6* 16.0* 10.2* 6.0* - 3.4* 3.9 |
142.6 132.0 117.8 112.6 122.6 100.8* 104.2 90.2* 76.4* 73.0* 55.8* 6.9 |
0.392 0.383 0.380 0.350 0.261 0.302 0.265 0.168* 0.121* 0.069* - 0.082* 0.032 |
14.23 14.27 13.81 14.18 14.48 14.06 14.06 13.68 14.02 14.10 14.02 0.21 |
* Significantly different from that on the standard diet (P��0.01).���K Comparison of the estimated response1 of chicks at
different levels of leucine isolcucine and valine intake
Amino acid content |
Maximum2 (a) |
0.75 of maximum (b) |
0.25 of maximum (c) |
Ratio |
|
b��a |
c��a |
||||
| �@ | Body weight gain (g��d) |
||||
Leucine Isolcucine Valine |
7.05±0.51 7.33±1.02 6.42±0.47 |
6.57±0.45 6.74±0.41 5.90±0.54 |
2.77±0.43 2.02±0.45 1.77±0.61 |
0.93 0.92 0.92 |
0.39 0.27 0.28 |
| �@ | Gain�Gfood ratio |
||||
Leucine Isolcucine Valine |
0.473±0.031 0.462±0.031 0.486±0.024 |
0.420±0.037 0.430±0.028 0.450±0.029 |
0.202±0.034 2 0.136±0.023 b 0.158±0.034ab |
0.94 0.92 0.93 |
0.43 0.29 0.33 |
Values are means±confidence intervals at 0.95. Means not sharing a common superscript letter differ significantly between amino acids at P��0.05.
intake and nitrogen and energy balances of chicks from 14 to 24 days of age
under an ad libitum-feeding condition
Amino acid omitted |
Body weight change (g) |
Food intake (g) |
Nitrogen Balance (g) |
Energy balance (kJ) |
||||
None His Lys Trp Leu Phe & Tyr Thr Val Arg Ile Met & Cys All Pooled SEM |
92.2 - 5.6 - 10.8 - 16.6 - 16.6 - 19.8 - 24.0 - 25.4 - 25.6 - 25.8 - 31.4 - 34.6 1.6 |
a* b c d d de ef f f f g g |
217.0 81.0 82.0 80.6 61.6 49.4 60.2 61.2 62.0 39.4 56.4 42.6 5.2 |
a b b b c cde c c c e cd de |
0.228 0.127 - 0.025 - 0.227 - 0.275 - 0.523 - 0.463 - 0.450 - 0.466 - 0.721 - 0.798 0.049 |
a b b c d d e e e e f f |
960 - 83 - 111 - 196 - 312 - 328 - 331 - 336 - 274 - 355 - 302 - 338 25 |
a b b c de de de de d e de de |
���Q Effect of single essential amino acid deprivation on body weight change and
nitrogen and energy balances of chicks from 14 to 24 days of age under an
equalized-feeding condition.
Amino acid omitted |
Body weight change (g) |
Nitrogen balance (g) |
Energy balance (kJ) |
||
None His Lys Trp Phe & Tyr Leu Ile Val Thr Arg Met & Cys All Pooled SEM |
- 8.0 -11.2 -11.6 -12.6 -14.2 -16.4 -17.0 -17.4 -20.6 -22.8 -24.2 1.3 |
a* b bc bc cd cde de ef ef fg g g |
0.547 0.173 0.023 0.093 -0.112 -0.209 -0.312 -0.385 -0.271 -0.439 -0.513 -0.546 0.045 |
a b c bc d de efg fgh ef ghi hi i |
- 143 - 114 - 97 - 134 - 132 - 202 - 96 - 135 - 112 - 126 - 110 - 85 23 |
�i��Ħb�餺����Ƥ��Ѳv�A���ʼv�T�j���J��ĩM���ʼv�T�p�����i�ġA�[�����˪����P�A�b��ӹ}�ơA���i�Ĥ��Ѭ��G��ƺҪ����Ѳv�A��ܥX��J��ħC���ƭȡC�b�ʥF���i�Ī��}�Ƹ̲��i�Ĥ��Ѭ��G��ƺҪ����ѳQ����ۡA�۹�a�A�b�J��Ĥ��ʪ��}�Ƥ��A��ܥX���ӹ}���ٰ�����v�Q���ѹ��o�ˡA�b�J��Ĥ��ʮɡA��Ƥ��Ѧ��ܦ����ɦV�C�۹諸���i�Ħb���ʮɷ|�ͧ����Ƥ��Ѥ��@�ΡA�Ϥ��ʲ��i�Ī��v�T��p�C����J�ս誺�s���N�´`���t�O�p��O�H
��J�ս�s���N�´`���M�i�����i
���a�b�A��J�ս誺�Ͳ��O������J�ս誺�n�W�C�q�H�e�N�H������q�P��ƪn�q���t�ӵ����C��J�ս�n�W�q�O�X���q����Ѷq���w�q�U�A��J�ս�s���N�´`�����w�~���N�q�C�����Z�����O�������ʳJ�ս�M���J�ս�}�ƮɡA��ܥX���H�ۮɶ����W���A��J�ս�n�W�q�A��J�ս�X���q�M��J�ս���Ѷq���ܰʡC��J�ս�X���q�M���Ѷq���O�̹}�ƳJ�ս�t�q���ܰʦӧ��ܡA�i�H�F�Ѩ���J�ս誺�X���q���ܰʴT�פ���j�C
���Q�@�O�����Z���������ʳJ��ĩ����i�Ī��}�Ʈɪ��J�ս�X���q�C�̤��ʳJ��Ĥ��}�ƩάO�������i�Ĥ��}�ơA��J�ս�X���q�|���N�a��֡C�̲�´�O�ӬݡA�i�H�A�Ѩ�D�n�Z�J���X������l�c����ֳ̤j�C�|�@�Ӥ�����ݪ��Ҥl�A��������������(��)�����J��ġA���i�ħ������ʪ��}�ơA�p���Q�G�ҥܡA�������餺��J�ս�X���v�O��Ӳճ̰��A�䦸�O���ʲ��i�Ĺ}�ơA�A�䦸�O���ʳJ��ĥ[���i�Ĺ}�Ƴ̧C�C ��11 Effect of methionine or lysine deficiency on protein synthesis and protein synthesisper unit RNA of whole body, liver, magnum and remainder oviduct in laying hens.
Diet |
Expt 1 |
Expt 2 |
||||
Control |
Methionine deficient |
SEM |
Control |
Lysine deficient |
SEM |
|
| �@ | Protein synthesis (g��day) |
|||||
Whole-body Liver Magnum Remalnder oviduct |
44.3 7.4 4.0 1.3 |
32.8** 5.6** 2.5** 0.5** |
3 0.4 0.3 0.1 |
44.5 7.4 4.1 1.2 |
30.0** 4.3** 0.8** 0.3** |
0.9 0.4 0.2 0.1 |
| �@ | Protein synthesis per unit RNA (g protein synthesis��day per g RNA) |
|||||
Liver Magnum Remainder oviduct |
11.3 12.3 7.2 |
9.4 * 10.1 NS 2.5 ** |
0.5 0.9 0.7 |
11.4 12.4 6.2 |
9.0* 3.8** 2.2** |
0.6 0.6 0.2 |
Number of birds used was 7 per treatment.
Significance level�G**�AP��0.01�F*�AP��0.05�FNS�Anot significant.�@
��12 Fractional and absolute protein turnover rates in the whole body of chicks fed
control, histidine-free (-His) or methionine plus cystine-free (-Met, Cys) diets.
Diet |
Fractionaol protein rutnover rate (�H��day) |
Absolute protein turnover (�H��day) |
|||||
Synthesis |
Degradation |
Synthesis |
Degradation |
||||
Control -His -Met, Cys * Pooled SEM |
22.68 16.81 14.80 0.68 |
a b b |
18.04 17.78 18.07 1.11 |
7.26 3.51 2.44 0.24 |
a b c |
3.68 2.98 0.26 |
a b b |
n=6. * One missing value. a.b.c.�FP��0.05.�ܩ�J�ս���Ѳv�O�Ҧ����}�Ƴ��j�P�ۦP���C�]���A�i�F�ѡA����J�ս�X���v�M���Ѳv���t�Ҫ��ܪ���J�ս�W�[�v�O�A����J�ս�X���v���ܰʪ����G�C �J�ս�s���N�´`�������w�O�ާ�J�ս�S�w�ơA�i�H�լd�X�S�����J�ս�s���N�ª��`���C�Ҧp����Ŧ�K�̲y�J�ժ�IgG�X���O����Ŧ�J�ս�X���q��27�H�A�����X���v�O700�H����A�i�H�F�Ѩ�O��L��Ŧ�J�ս�X���q��15���C
�ĥ��i�����i�S���ʪ���i�����k
�H���Q����Ƭ������ܡA�ĥ��i�����i�S���ʥHchemical score��i�������k�����G�C�b�Ϫ���b�W���ܤ��ʥ������i��ġA�H�L�J�ս�}�ƪ���i���@0�A�зǹ}�ƪ���i�����@100���ɭԡA��ܤ��ʦU���i��Ĺ}�ƪ���i���C�u�W���U�I���ܧ����S���]�t�U���i��Ī��}�Ƥ���i���A�P���b�����I�O�魫���ܤơC�i��ķU�R���A����U�O�۹�a�����A�Ϥ����U���I�O�U���i��Ī��n�D�q��v20�H�A40�H�A60�H�A80�H�����ΡC�}�Ƥ��p�G����2�إH�W���i��Įɭp���U���i��Ī����ʵ{�סA�⥦���ܦb�Ϥ��A�䤤�̧C�������I���ܨ�}�ƪ���i���A�����i��ĴN�O�Ĥ@�����i��ġC�b�Ϥ������������i�Ĺ}�ƪ��۹���i���O46�A�۷���ɥR���J��ĥ[���i�ĭn�D�q��43�H�A�٦��������ʲ��i�ġA�}�Ƥ��۹���i���O57�A�۷���ɥR��54�H�J�i�ĥ[���i�Ī��n�D�q�C��ڤW�O��˪����ΩO�H�ڭ̹���p�U�G
�������ʲ��i�ġA�}�Ƹ̱N�J��ĥ[���i�ĥ[��n�D�q����U�ӵ{�פ����U�Ӭq�������A��n�D�q��49.8�H�ɪu�۳J��ĥ[���i�Ī��{�צ��ܰʡA�A�W�h�N�ۦP�Ӥ��ܤF�C�J��ĥ[���i�Ī��K�[�q�O�n�D�q��0��44.7�H�ɡA�O�M�J��ĥ[���i�Ī��K�[�{�פ@�_�ܰʡA�A�W�h���ܴN�ܱo�ۦP�F�C���o�˦bChemical Score�̱N�i�����i�S���ʥ[�i�h���Q�k�M���絲�G�O�@�P���C ���Q�T�O����3�إH�W�i��Įɪ�����A�۹���i���M���窺�ƭȬO�@�P���C ��13 Effect of varying levels of sulfur-containing amino acids (SAA) and threonine onbody weight change of chicks fed histidine-free diet
Diet |
Amino acid level (�Hof reauirement) |
Chemical score |
Body weight change (g��10 days) |
Nutritional |
||||
His |
SAA |
Thr |
score by weight |
body change |
||||
1 2 3 4 5 6 7 8 9 10 11 Pooled |
0 0 0 0 0 0 0 0 0 0 100 SEM |
0 0 0 0 40 40 40 80 80 80 100 |
0 0 40 80 0 40 80 0 40 80 100 |
0 0 0 0 0 0 0 0 0 0 100 |
- 23.4 - 20.6 - 19.5 - 19.8 - 15.4 - 10.4 - 9.8 - 15.0 - 7.8 - 9.0 7.0 1.3 |
a a a* a b c c b c c d |
(0)1 (9) (13) (12) (26) (43) (44) (28) (51) (47) (100) |
0 5 5 5 24 43 43 24 54 57 100 |
n=5. * One missing value. a,b,c,d,�FP��0.05.Values in the parenthesis represent percentage relative to the growth response achieved with control diet.
�@
�ѥH�W�Ҵ��i�����i�S���ʪ��רҧ��M��ڤW�i�����רҬ۰t�X���C�]���է@�F�b�n�D�q�����ιL�ѮɡA��Q���б�(1981)�b���Q�|���U��`�Ѹ̴��Ҥ@�ӲŦX�ʪ������������C�Ҧp��o�Ӥ����M�Φb���Ī��n�D�q�W�C�H�e�ҰQ�׳��O���w�������u�����u�Ө��C
��14 Fitness of the regression using the four-parameter kinetic equation�� to growth
responses of chicks obtained by verying the dietary levels of individual essential amino acids
Amino acid |
Estimated parameters |
Contribution rate2 (R2) |
|||
b |
K |
Rmax |
n |
||
Arg His Ile Leu Lys Met��Cys Phe��Tyr Thr Trp Val |
-26.20 - 4.05 -23.79 -12.96 -10.98 -32.94 -17.41 -24.33 -17.32 -25.49 |
53.26 66.28 65.59 56.88 48.82 36.57 63.48 58.03 37.81 76.10 |
103.92 103.76 103.82 105.44 103.64 104.03 105.57 104.46 115.03 109.40 |
4.740 4.467 5.733 3.502 3.852 2.321 5.211 5.467 1.846 4.630 |
0.951 0.958 0.961 0.970 0.964 0.977 0.936 0.985 0.920 0.970 |
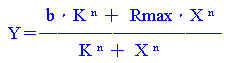
Where b, k, Rmax and n stand for Yintercept, X value required for a half maximal response, asymptotic maximal value and a nutritional constant related to the sigmoidicity of the curve, respectively.
2.All the R valuec were significant at P��0.001. �ĥΤF�o�Ӥ�������A�i�H�F�Ѩ즹�ؾA�X���ڪ�(�ƭ�)��ơC�b���Q�|�̥i�H�o������U���i��ĩұo�쪺�ƭȡC�ƭȸ�ƬO�ĥι�ħZ�������������i��IJV�X���}�ƨ�4�g�j�C�|�ĥ��i��IJV�X�b�}�Ƥ���(�ƭ�)��ơA�O�Ҽ{�줣�n�t���J�ս���Ʋv�B�i��Ħ��IJv�����]���CB���ƭȬO���i��ħt�q�O0�ɪ��۹令���q�AK�O��50�H���۹令���q�A���n���U���i��Ī��q�A�N��H�n�D�q���ʤ��v(�ʤ���)�Ӫ��ܡARmax�O���̤ܳj���۹令���q�An�O���ܦ��u���ɱר��סA�ƭȷU�����u�s���U�j�CR2�O�^�m�v�A�U������1���A���u�M��ڪ��ƭȷU�@�P�A�^�m�v�N�|�U���C�b�o�Ӥ����A�i�H�T�w�������M�Φb�@�X���Ʀ��ɨS���Ψ쪺�ƭȨӧ@�H�ড���窺���G�A��̪��^�k�����ʤj�C��ܥX�i�H�Ψӥ��T�a�w���A�Q�Υ������է@�������U���i��Ī������ϡC�b�a�b�Φʤ���Ӫ��ܬ۹令���q�A�A�����A��Ӥ饻�}�ƼзǡA�b�}�Ƥ��t�����i��Ī��q�Φʤ���Ӫ��ܡA�۹�a�A�U���i��Ī������ι�u�Ӫ��ܡC�I�u�����i��Ī���i�S���ʤp�ɪ��i��Ī������C���Ī�������n�D�q�C�ɡA�|����i�İ����A��ܥX�����ܦ������i���������n�D�q�����ܡA�i�H�F�Ѩ���i�ķ|����e���ܦ������i��ġC���J�i�ĥ[���i�Ħb����C�{�ɷ|���m�B�i�ħ�O�����i��ġC�Ӥ�����{�ɡA�m�B�i�ķ|��J��ĥ[���i�ħ�O�ܦ������i��ġC�p���A�լd�F�U���i��ġA�q������k��������N�O�����i��Ī�����C
���ṳ�o�˵����u��������4�g��(4�g�j)�A��N�������첣�Z���άO�����A�i�H�N�ؼд¦V�ϥιq������(computer simulation)���覡�C�@
�}����i���x(64~84)
90�~�D�ĤK���w�b�թ�
Copyright © 1998 ![]() �Z�s�n�b����.
�������Ϥ�Y���Z�s�n�������q�A���大���v�������x����
�Z�s�n�b����.
�������Ϥ�Y���Z�s�n�������q�A���大���v�������x����
���A�D�g�����q�θ����x�������ѭ��P�N�A���o�N�����γ������e�A
����������C��
�� �̨θѪR�� 800x600
Copyright © 1998
MiobufferCo., Ltd. All rights reserved.
Unauthorized copying and reproduction is prohibited. All trademarks property of their
respective holders.